What US Arts Participation Data Can Tell Art Supply Buyers
A market forecast can look precise while hiding what was counted. Art supplies, stationery, school materials and creative hobbies are not the same market boundary. Buyers should use public data to understand who participates in art activities, then test product demand with their own channel evidence. This article uses two U.S. public research sources and keeps their limits visible.
Why Market-Size Headlines Need a Definition
Published “art supplies” figures can include different products, channels, geographies and years. A forecast may combine consumer retail, school procurement and general stationery, or exclude some of them. Comparing two headline values without checking those boundaries can create a false impression of growth or a market-share opportunity.
Before using a forecast in an assortment plan, ask: What exact products are counted? Does revenue mean manufacturer sales, wholesale sales or consumer spending? Which countries and channels are covered? What is the base year? Is the growth figure observed or projected? Does the study disclose its method and uncertainty? If those answers are unavailable, the number should not decide a purchase order.
What the 2022 U.S. Adult Participation Survey Says
The NEA’s 2022 Survey of Public Participation in the Arts is a nationally representative survey of U.S. adults covering the 12 months ending July 2022. The 52% figure refers to creating or performing art broadly. It includes activities beyond drawing and painting, so it cannot be translated into the number of people buying pencils, brushes or paint.
The NEA says the 2022 rate is roughly similar to its 2017 finding, but the two surveys used different sets of measures. That is a reason to avoid a simple “adult art making is accelerating” claim. The survey is valuable for understanding participation, yet it does not report product prices, brands, purchase frequency or stock levels.
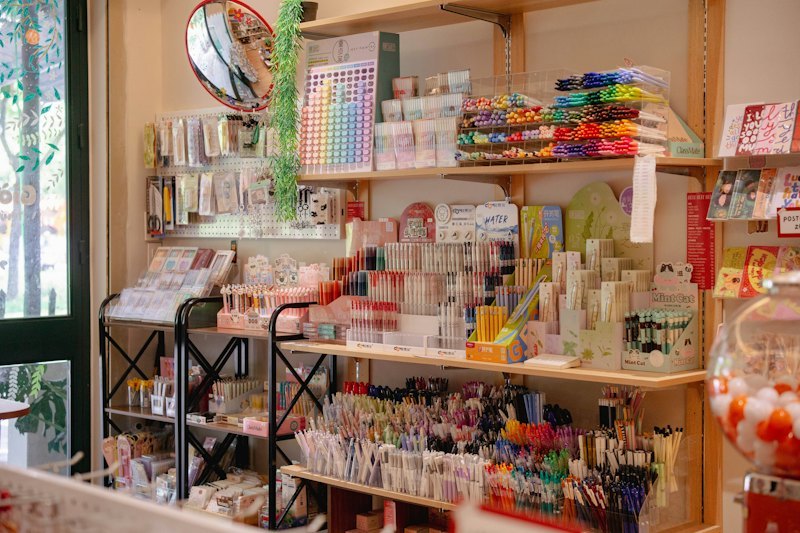
For a buyer, the practical question is which of those participants your channel actually reaches. A specialist art retailer, a general gift store and a school distributor will see different tasks and budgets. Use customer questions, sell-through and returns to establish which products solve a need in your channel.
What the 2024 U.S. School Survey Says
The NEA’s analysis of the NCES School Pulse Panel draws on responses from more than 4,000 U.S. public K–12 schools in November 2024. It reports that 82% offered a standalone visual arts class during the regular school day. The survey also measures instructional time, staffing and perceived resources.
Course availability establishes that visual arts instruction is common in the surveyed public-school system. It does not show how much a district spends on supplies or which SKU it orders. The study does not represent private schools, Europe or the global education market. An individual school’s curriculum, class size and purchasing process remain the relevant evidence for an RFQ.

Turn Public Context Into a Testable Assortment
Begin with two or three clearly different user tasks. A beginner drawing set can be tested for sharpening, palette and storage. A watercolor set can be tested with the paper and brush a customer will use. An artist line may need color-specific lightfastness evidence and replacement colors. These are examples of test design, not categories predicted to grow by the surveys.
For each candidate, record the intended user, sample performance, price, sell-through, returns and replenishment options. Review the results after a defined selling period. Compare like-for-like SKUs across your own stores or accounts. A local pilot gives stronger purchasing evidence than applying a global percentage to an unfamiliar product line.
Ask for Evidence That Matches the Decision
If the decision is about classroom usability, ask teachers to complete a sample lesson and identify breakage, cleanup and storage problems. If the decision is about retail range width, review actual shopper questions, color demand and repeat purchases. If the decision is about market-entry compliance, ask for SKU-specific documents and current official rules for the destination.
Keep the evidence in separate columns: official participation or education statistics; your own observed sales and user feedback; supplier product specifications; and assumptions still to be tested. This prevents an arts-participation statistic from being presented as a verified art-supply sales forecast.
A Five-Question Check Before Using a Market Claim
- Who collected the data, when, and for which geography?
- What population, products and activities were actually measured?
- Is the figure observed, modeled or forecast?
- What does the source say about method and limitations?
- Does the figure answer this SKU decision, or do we need our own test?
For the sources used here, the answer to the fifth question is usually “we need our own test.” The 2022 adult participation survey and November 2024 public-school survey offer useful U.S. context, but neither substantiates a 2027 global art-supplies market forecast.
Sources and Scope
NEA, Arts Participation Patterns in 2022: U.S. adults; activities in the 12 months ending July 2022; report released in 2023. NEA/NCES, November 2024 School Pulse Panel arts brief: U.S. public K–12 schools; November 2024 responses from more than 4,000 schools; publication page does not state a clear publication date. Both were checked on 12 November 2026. Neither is a global product-sales dataset.